Visual Chart Designer Pro | Build Any Chart in Unreal Engine 5
Visual Chart Designer Pro - author data-driven charts as Content Browser assets, edited in a live five-region designer.
Build charts the way you build the rest of your game: as assets. Visual Chart Designer Pro turns a chart into a Chart Document you create, name, theme, and reuse - edited in a real asset editor whose live preview uses the exact same Slate paint path your game ships with. What you see in the designer is what renders at runtime.
8 Chart Types Included Live Styling & Visual Editing Only 3 Blueprint Nodes to Fully Operate Built in Colour Pallets & AI Theme Design Interactive Charts & Event Hooks Easy Export to UMG HUD CSV & JSON Import Feedback & Feature Request Panel
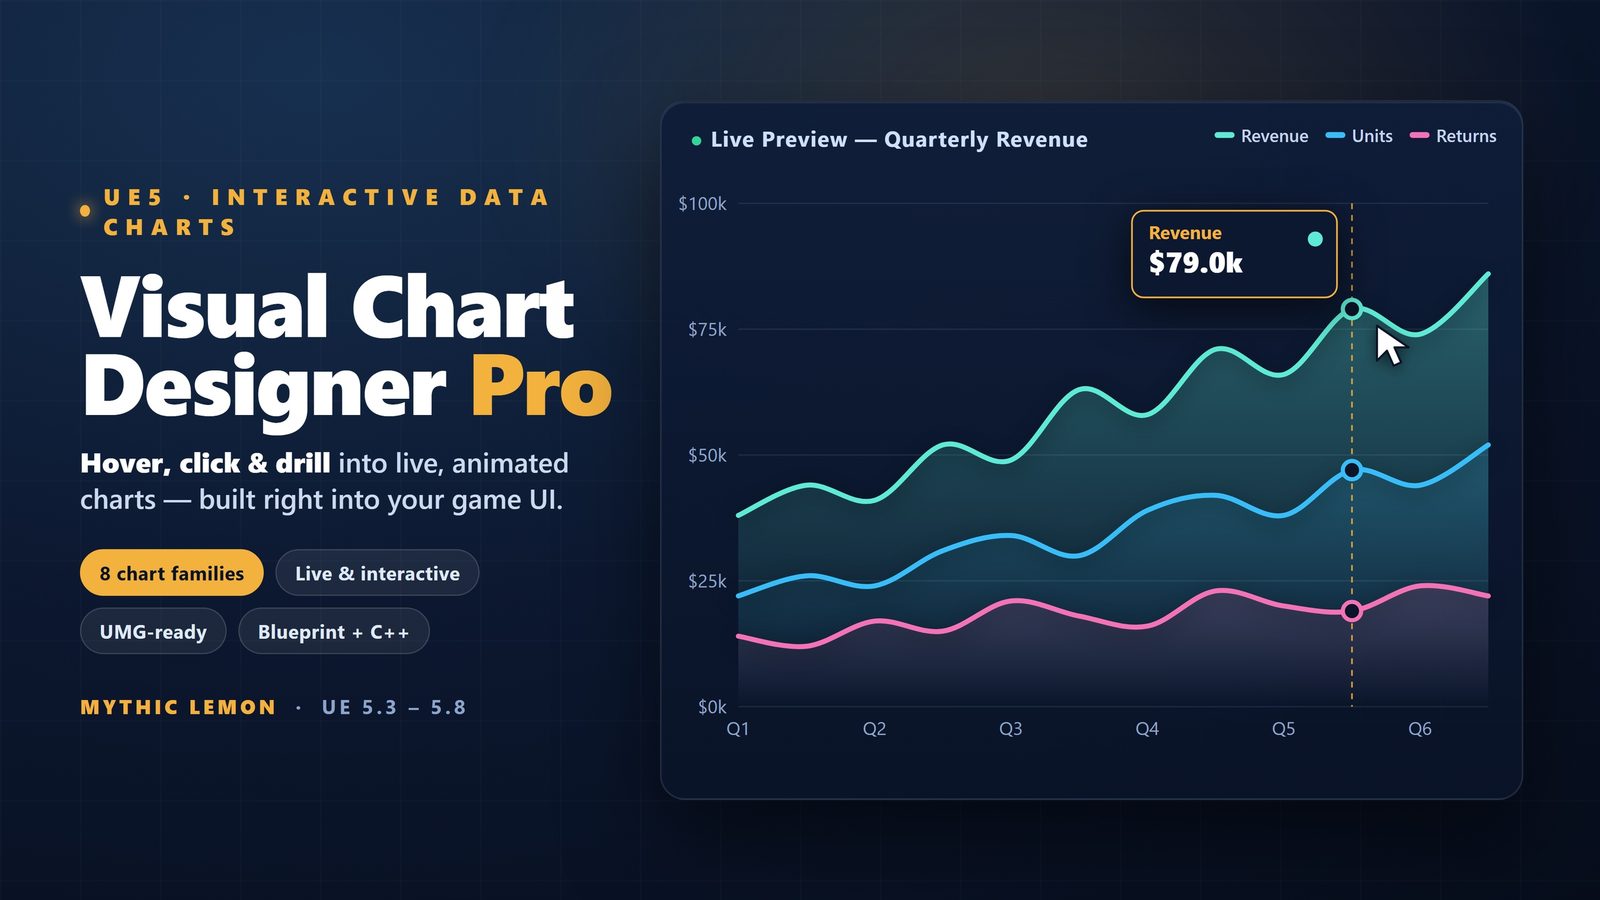
Eight chart families, one renderer Line, Area, Scatter, Bar, Pie, Donut, Polar Area, and Radar, all drawn by a single high-performance Slate renderer.
A real five-region asset editor Double-click a Chart Document and you get a live preview hosting an actual chart widget, an outliner, a details panel, a data-simulation panel, and a toolbar (Mint, Apply Theme, Save As Theme, Reset, Capture Thumbnail, Open in UMG). Scrub the controls and watch the chart animate in real time.
Themes and curated palettes Save any look as a reusable theme asset and apply it across projects. A built-in palette library ships dozens of researched designer, brand, and colour-theory sets, with automatic contrast for pie, donut, and polar slice labels and a manual override when you want one.
Data without a god-object Charts get their series from a data source - engine stats, game state, static authored data, or DataTable / CSV / JSON import. Add a new data shape by subclassing the data-source base and it appears automatically in the simulation dropdown. Rolling-window and real-time updates are built in.
Ship it to your U One click sends a configured chart into a UMG Widget Blueprint, complete with a worked-example event graph so you can wire live data from Blueprint immediately. Full pointer interaction - hover, tooltips, and hit-testing - is built in.
Optional AI styling assistant (off by default) Describe the look you want in plain language and let the assistant restyle the chart. It is opt-in, uses your own OpenAI or Anthropic API key, and only sends data when you trigger it (see the disclosure below).
Visual Chart Designer Pro
Design data-driven charts in a live editor, then open them straight in UMG.